Tutorial / User Guide
Deconvolution Analysis Tutorial
Step-by-step guide from expression matrix upload to cell composition analysis
What is this tool?
ODlab estimates cell-type abundance from mixed expression profiles using integrated deconvolution models. It supports Bulk samples and spatial transcriptomics spots, then connects the output to composition, clustering, survival and pathway analyses.
Run deconvolution
Start with expression and a model-compatible reference. The model estimates abundance.
Analyze existing abundance
Import abundance you already calculated. Add metadata or expression for downstream analyses; no model rerun.
Workflow overview
Input data
Prepare expression & IDs
Quality control
Upload and validate
Reference selection
Review compatible reference
Deconvolution model
Submit and monitor
Result visualization
Explore and export
In the actual workspace, choose Bulk/ST and a model first, then upload the files requested by that model. Existing-result import goes directly from validation to visualization.
Tailor the guide to your data
Prepare a pre-deconvolution gene expression matrix and the reference required by your selected model. Each row represents an independent sample; provide clinical metadata for grouping and survival.
| File | Filename example | When needed | Per-file limit |
|---|---|---|---|
| Expression | bulk_expression.h5ad | Required | 256 MB |
| Reference | bulk_reference.h5ad | Required by supervised models | 1024 MB |
| Metadata | bulk_metadata.csv / .tsv | Optional; grouping / Bulk survival | 256 MB |
<dataset>_<role>.<extension>. Dataset names contain 1–64 lowercase letters, digits, underscores or hyphens. For example: brca_expression.h5ad and brca_metadata.csv. Built-in examples retain their published names.Expression structure
Expression uploads currently accept H5AD only. Rows are samples (Bulk) or spots (ST); columns are genes. Put entity IDs in the obs index and gene IDs in the var index. X holds the intended expression layer. If your source table has genes as rows, transpose it before creating H5AD.
| Sample / obs | CD3D | MS4A1 | EPCAM |
|---|---|---|---|
| Sample_1 | 120 | 35 | 8 |
| Sample_2 | 90 | 62 | 15 |
Conceptual preview, not a CSV expression upload. H5AD query files require sparse X/data, X/indices, X/indptr and explicit obs/var indices. Values must be finite and nonnegative, with unique gene and entity IDs.
Gene identifiers
Use one naming scheme and the same species in reference and expression. Shared genes are required. The current pathway reader matches gene names directly; prefer gene symbols for human Reactome/GO.
Normalization
Follow the model’s count/normalization requirements. Count-based models require integer counts in X. Do not upload log-transformed data as counts or negative z-scores as expression. Microarray profiles have no separate upload mode and need model-compatible preprocessing and H5AD conversion.
Metadata fields
| Column | Requirement | Used for |
|---|---|---|
| sample_id | Unique, nonempty; exact abundance/expression match | Joining files |
| group | Nonempty; at least two groups | Clinical comparison / metadata grouping / KM |
| survival_time | Finite, positive; use days consistently | Cox and KM |
| event | 0 = censored; 1 = event; no missing values | Cox and KM |
All four columns are required if you upload Bulk metadata. Additional endpoints such as OS/DSS/PFI and clinical columns may be included. If patient_id is supplied, survival analysis keeps one sample per patient by a fixed sample-ID order.
Open New Analysis and choose Run integrated deconvolution model.
Upload in the analysis workspace
Select Bulk/ST and a model, create the task, then attach each file to its matching upload slot. Choose file uploads your local data; Load Example File attaches a server example.
Open upload workspace ↗| Validation | What is checked |
|---|---|
| Filename and format | Role suffix, allowed extension and file size |
| H5AD content | Index uniqueness, X dimensions, sparse structure and numeric values |
| Clinical metadata | Required fields, positive times, 0/1 events and nonempty groups |
| Cross-file IDs | Companion files cover primary expression/abundance IDs; extra rows are reported |
| Model inputs | Required files, shared genes and applicable counts/donor settings |
Current server limits: 1024 MB for Reference; 256 MB for each other file. A task may use up to 2048 MB of stored data. Limits use 1024 × 1024 bytes per MB.
Supervised models use a single-cell Reference H5AD with categorical obs.cell_type labels. It is not a generic precomputed signature CSV. Your reference determines which cell types the model can estimate.
Server example reference
Use Load Example File in the Reference slot to attach the configured server file. Inspect its labels and compatibility before interpreting results.
Your own reference
Upload a matching tissue/species reference with unique cell/gene indices, cell_type labels for every cell, and at least two annotated types. Some models also require donor/sample identifiers.
| Reference annotation | Example |
|---|---|
| obs index | Cell_1, Cell_2, … |
| obs.cell_type (categorical) | T_cell, B_cell, … |
| Donor/sample field if required | Donor_1, Donor_2, … |
No-reference models may not request a Reference slot. Choose a model suited to your input and review its required inputs on the Models page.
View model requirements ↗The configuration workspace displays parameters from the selected model’s manifest. Save Parameters and inspect the validation report before submission.
| Setting | How to choose |
|---|---|
| Expression preprocessing | Use the data layer expected by the model; not a universal normalization toggle |
| Cell-type labels / resolution | Review reference.cell_type; only supported model-specific selections appear |
| Algorithm parameters | Use manifest defaults first; advanced options differ between models |
| Downstream clustering | CLR or z-score; abundance auto-K or direct metadata grouping |
| Survival endpoint | Choose an actual validated time/status pair; event value is fixed at 1 |
| Confidence / significance | Review model-specific outputs, 95% CI and FDR; no universal confidence-threshold input |
Submit the task after required files and compatibility checks pass. The running page polls status and shows the execution stages and logs. A completed model opens the result workspace; downstream analyses run separately.
If FAILED appears, inspect the stage and error message. Correct the input or parameter issue before resubmitting. Use History to reopen accessible tasks in the same browser; cancelling a task stops its pending work.
Open task history ↗Start with the abundance table. An estimate describes a cell population’s inferred contribution; depending on the model, it may be a proportion or absolute abundance. Do not interpret every model output as a fraction summing to one.
| Sample | Cell type | Fraction (example) |
|---|---|---|
| Sample_1 | T_cell | 0.50 |
| Sample_1 | B_cell | 0.30 |
| Sample_1 | Epithelial | 0.20 |
| Module | Question answered | Required information |
|---|---|---|
| 01 Composition | Which cell types contribute to each sample/spot? | Abundance; metadata for clinical grouping |
| 02 Clustering / grouping | Which profiles are similar or share a metadata group? | Abundance; matched coordinates for spatial clustering |
| 03 Cox association | Which cell abundances associate with risk? | Independent Bulk samples, time and event; ≥10 samples / ≥3 events |
| 04 Kaplan–Meier | Do group survival curves differ? | Valid Bulk endpoint and at least two groups |
| 05 Pathway association | Which pathway scores correlate with cell abundance? | Matched expression, ≥5 entities and usable gene sets |
Completed-task figure examples
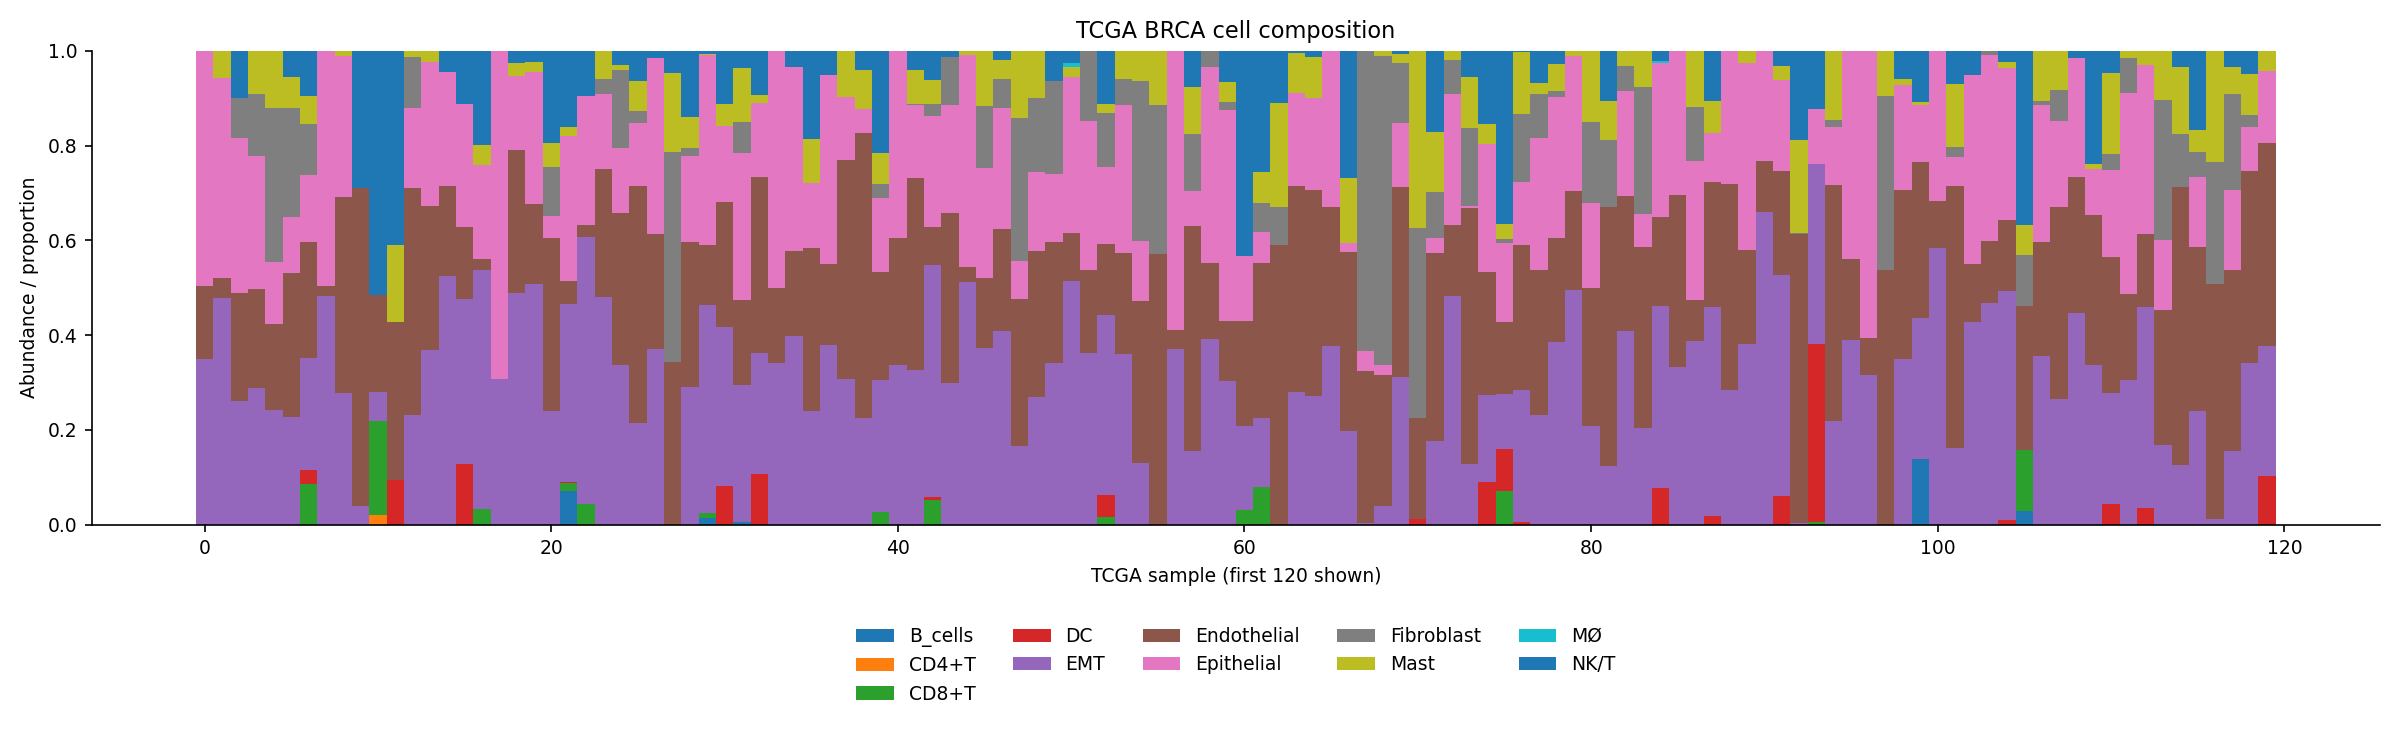
Archived TCGA task output, used to explain figure interpretation. The live UI, cohort and parameters can differ; these images do not replace your task’s results.
| Quality check | What to inspect |
|---|---|
| Inputs | ID coverage, reference gene overlap and correct expression layer |
| Clustering | Actual method/scale, selected K, excluded rows and saved group column |
| Cox / KM | Matched N, events, 95% CI, convergence/PH diagnostics where reported; KM risk counts and censor marks |
| Pathways | Gene coverage, rho, global FDR and paired sample-level scatter |
| Exports | PNG/SVG from the chart controls; plotting/statistics CSV and saved result artifacts |
Run each eligible module in the result page. Missing optional inputs disable or prevent the affected analysis; an unsuccessful downstream module does not invalidate a successful deconvolution. Top30 pathway labels use P1–P30 with the full mapping below; click a heatmap cell to inspect activity versus cell abundance.
Current retention setting: 3 days. Download your files before automatic cleanup removes task assets.
FAQ & troubleshooting
What input data should I prepare?
For deconvolution, use an expression H5AD and the reference requested by your model. In this platform, rows are samples/spots and columns are genes. Bulk metadata adds group, survival_time and event. Existing abundance uses CSV/TSV with sample_id or spot_id first.
Can I upload a CSV, TXT or TSV expression matrix?
Not directly. Expression and Reference slots currently accept H5AD. CSV/TSV are supported for abundance and metadata; coordinates use CSV. Convert a tabular expression matrix before upload using the preparation example.
What does cell abundance mean?
It is the model’s estimate of each cell population’s contribution. Check whether your model produces proportions, relative scores or absolute abundance before interpreting or comparing outputs.
Can I use my own reference?
Yes: a model-compatible Reference H5AD with categorical cell_type annotations. A precomputed signature CSV is not a universal accepted input. Gene naming, species, tissue and donor requirements must match your chosen model.
Why does a file fail validation?
The error reports the relevant naming, size, field, value, index or matching issue. Check the filename role, required metadata columns, ID uniqueness and matrix dimensions. Optional files are still validated when supplied.
Why can’t I run all five modules on an ST slice?
A spot is not a patient. Composition, spatial clustering and pathway analysis can work at spot level; Cox and KM need independent Bulk samples with genuine survival observations.
Do clinical metadata affect deconvolution?
The external metadata file mainly supports downstream grouping and survival. Reference cell_type and model-specific donor/sample annotations are different: those can participate in model fitting.
Why do my results differ from the tutorial images?
Images are archived examples. Your reference, sample cohort, abundance, endpoint and parameters determine actual curves and effect sizes. Correct plots need not reproduce the same biological pattern.
How do I recover a failed task or unavailable module?
Inspect task logs for model failures and the affected module’s message for downstream failures. Provide the missing input or fix the mapping, then rerun the applicable operation. Download results before the configured retention period expires.
Ready to use your own data?
Create a task, validate the inputs, and interpret the modules that apply.